abelard's home latest changes & additions at abelard.org link to document abstracts link to short briefings documents quotations at abelard.org, with source document where relevant click for abelard's child education zone economics and money zone at abelard.org - government swindles and how to transfer money on the net latest news headlines at abelard's news and comment zone
socialism, sociology, supporting documents described Loud music and hearing damage Architectural wonders and joys at abelard.org about abelard and abelard.org visit abelard's gallery Energy - beyond fossil fuels France zone at abelard.org - another France

Antarctica melting ice, glaciers, sea levels, water and weather implications

a briefing document

New translation, the Magna Carta

This page helpful?
Like it ! Share it !
click to see all the indexAntarctica melting ice, glaciers, sea levels, water and weather implications is one in a series of briefing documents investigating the indicators, science, analysis and argument surrounding global warming.
One of a grouping of documents on global concerns at abelard.org.
on energy on global warming
sustainable futures briefing documents

On housing and making living systems ecological

Tectonics: tectonic plates - floating on the surface of a cauldron

click to see all the indexIndex
large antarctic melt in 2005
the melting of glaciers
reference glaciers
interesting ‘facts’ and figures about antarctica
past ice ages and interglacials
5°C increases in sea temperatures required to melt west antarctic
agw - how much land will be lost to the global melt?
new resource of Antartica imaging
glossary
bibliography

related document
Arctic melting ice, sea levels

site map


advertising disclaimer

large antarctic melt in 2005

Antarctica, satellite photo from 2005, marked 
        to show location of Larsen ice shelf Image credit: NASA/JPL.
Antarctica, satellite photo from 2005, with various data added. Original image credit: NASA/JPL
65°S is the equivalent distance from the South Pole as Iceland is from the North Pole.
Compare with Antarctica map and commentary at temperature and statistics

Recommended, clear article.

“A team of NASA and university scientists has found clear evidence that extensive areas of snow melted in west Antarctica in January 2005 in response to warm temperatures. This was the first widespread Antarctic melting ever detected with NASA's QuikScat satellite and the most significant melt observed using satellites during the past three decades. Combined, the affected regions encompassed an area as big as California.

“The observed melting occurred in multiple distinct regions, including far inland, at high latitudes and at high elevations, where melt had been considered unlikely [...]”

“Antarctica has shown little to no warming in the recent past with the exception of the Antarctic Peninsula [...]

[Note that the part of the peninsular (Larsen Shelf) which suffered large shelf losses in recent decades is further north than the rest of Antarctica.]
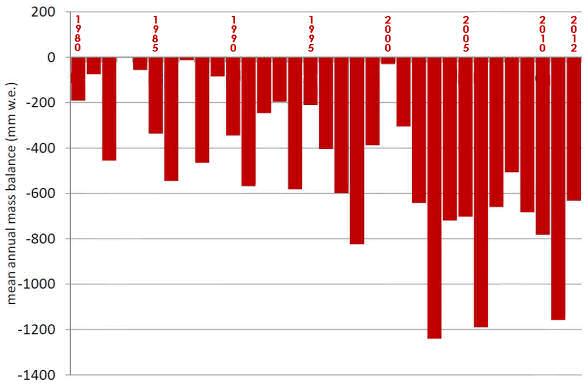
“Changes in the ice mass of Antarctica, Earth's largest freshwater reservoir, are important to understanding global sea level rise. Large amounts of Antarctic freshwater flowing into the ocean also could affect ocean salinity, currents and global climate.”

continent / country area in square kilometres
Antartica 14,000,000
Russia 17,075,200
Canada 9,984,670
USA 9,826,630
China 9,596,960
Brazil 8,511,965
Australia 7,686,850

the melting of glaciers

diagram showing glacial ice evolution - melting and slipping away from the bedrock
interactive image: hover with your mouse, clickable areas change to a hand icon
diagram showing glacial ice evolution - melting and slipping away from the bedrock.

  • The ablation zone is where there is an overall loss of glacial material, as the amount of ice melting in Spring and Summer exceeds the amount of Winter snow deposits. The accumulation zone is where snow fall exceeds melting. A balance zone is deemed between these two.

    Although presently, there is a widespread recession of glaciers, be aware that a glacier is a dynamic system that may be advancing one year, and receeding another. Thus, the position of these zones will alter.

  • A warmer planet is expected to be a dustier planet. Vast quantities of dust from erosion and desertification are already being shifted around the planet. If this dust lands on the ice fields, it will reduce albedo. Of course, as the ice fields shrink, the albedo of the earth steadily reduces, adding yet another positive feedback

    Franz Josef glacier, New Zealand, 2008
    Franz Josef glacier, New Zealand, 2008

  • As the ice tongue (the leading edge of the glacier, protruding into the sea in the diagram at this section’s beginning) erodes, it has a partial effect of taking a stopper out of a bottle. This allows the glacier to flow more freely. The faster the glacier flows, the more friction heats up the underside of the glacier. As it becomes liquid, that liquid lubricates the glacier, allowing it to flow still more quickly.

  • Franz Josef glacier, New Zealand, 2008A glacier thinning results in lower downward pressure. Downward pressure can have two effects, depending upon the conditions:
    • helping to anchor the glacier to the rock substrate;
    • causing heating, and thus melting.

  • Glacier thinning lowers the elevation of ice, and lower elevations are warmer.
    The pressure of large masses of ice also depresses land elevation slightly, so there is some bounce-back as the ice fields melt.

  • On mountain glaciers, a common phenomenon is the undercutting of the rock walls at the sides of the glacier. This causes rock to fall onto the ice, and carves out the great U-valleys that someone probably taught you about in school. These rock falls also change the albedo of the ice surface.

  • The vulnerability of glaciers to melting varies according to their position in among mountains, to their latitude and to local geographic structure. As these factors vary, the amount of sun that strikes the glaciers throughout the day, and the year, changes. In a mountainous valley, one side may receive much more sun than the other side, which is usually in shade, or local mountains may block the sun.

reference glaciers

Worldwide glacier condition is tracked by thirty ‘reference glaciers’ on ‘nine continents’, and many other glaciers. For more details.

mm w.e. means the average number of millimetres of water equivalent (melted snow or ice) lost by the reference glaciers in a year.

Mean annual specific mass balance of reference glaciers

The lower the elevation of the glacier’s origin, the more threatened the glacier will be. A glacier terminating at sea level may be fed from much higher elevations. Obviously, similar conditions may apply to glaciers originating in Antarctica and in high latitudes. This must be considered when assessing the vulnerability of individual glaciers.

interesting ‘facts’ and figures about Antarctica

You will note, by the large ranges of some of these numbers reported by varying sources, that a lot of this is rather optimistic guesswork.

  • 45% of Antartica is fringed by ice shelves.

  • Only five percent of the Antarctica coastline is ice-free.

  • Probably fewer than a hundred thousand people have ever visited Antarctica.

  • Antarctica has thirty million cubic kilometres of ice. If this ice melted, the global sea level would rise by an estimated 56 to 80 metres. The Greenland ice sheet is estimated to be capable of rising sea levels by 6 to 7 metres. These ice sheets are estimated to contain about 70 to 90% of the world’s fresh water, 10% of that being in the Greenland ice sheet.

    the third pole of the world
    “At 4,776m, this was one of the great doorways to the top of the world. It was also the northern shore of a vast sea of permafrost that stretched more than 600km across the plateau towards Tibet and the Himalayas, prompting some to describe it as the third pole of the world. [...] The plateau and the mountain ranges around it contained 37,000 glaciers, some of which were 700,000 years old. Together they contained the largest body of ice outside of the Arctic and Antarctic.” [p.47, When a billion Chinese jump by Jonathan Watts]

    70% of the Earth’s surface is covered with water. In total, there is about 1½ billion cubic kilometres of water on the Earth. 97% of that water is sea water (so only 3% is fresh water).

    Satellite measurements of changes in sea levels are presently of the orders of small numbers of millimetres. Measuring and standardising such small differences is very difficult and must be treated with caution.The depth of the seas varies from place to place on the planet by virtue of gravity variations, thermal expansion, changing tides and the land rising and sinking (including that under the sea). Meanwhile, the height of the satellite must be measured against this varying background!

  • Greenland and Antarctic ice sheets, in places are as deep as three kilometres. Some of the ice sheet in Antarctica is certainly over 3.6 kilometres. Snow fall in Antarctica is much less than in Greenland. A given thickness of ice core in Antarctica can go back at least of 750,000 years.

  • The Antarctic forms a huge heat reflector effecting much of the world’s weather systems, and melting ice absorbs heat.

  • The land area of Antarctica is about fifty-eight times that of the British Isles.

  • Greenland and the west Antarctic ice sheets are widely grounded below sea level. As the ice sheets thin, the lowered weight decreases their grip on the land. As the ice shelves recede, the warming water can erode the ice sheet into an ice shelf, and thus the process advances.

  • Several processes are combining in positive feedbacks to increase the rate of melting of the ice sheets and glaciers.

  • Due to the high albedo of the ice sheets, they act as air-conditioning for the planet, as well as there being many communities that are dependent on glaciation to maintain a flow of fresh water during the summer season. There is widespread recession of the majority of glaciers around the world.

  • Other interesting statistics about Antarctica, such as its height or local sea depth, have no easily definable answer at the moment. This is because each figure decided upon depends both on how it is calculated, and that the height, sea depth or other dimensions may vary.

  • More interesting figures on conditions at the South Pole
  • The [South Pole] station stands at an elevation of 2,835 meters (9,306 feet)
  • There, the ice sheet is about 2,700 meters (9,000 feet) thick.
  • Station drifts at about 10 meters (33 feet) each year, with the ice sheet.
  • The Amundsen-Scott South Pole Station is 850 nautical miles south of McMurdo Station.
  • Recorded temperature has varied between -13.6° C and -82.8° C.
  • Annual mean temperature is -49° C
  • Monthly temperature means vary from -28° C in December to -60° C in July.
  • Average wind is 10.7 knots (12.3 miles per hour)
  • Peak wind gust recorded was 48 knots (55 miles per hour) in August 1989.
  • Snow accumulation is about 20 centimeters of snow (6-8 centimeters water equivalent) per year, with very low humidity.”

From the narrated tour of Antarctica - showing the satellite RADARSAT

There is a 5 minute video, Narrated tour of Antarctica through the eyes of RADARSAT. Because the download is onerous, abelard.org is no longer hosting a copy of this video on this page (the link provided is functional as at 23.11.2020).
This video was completed and accepted for the SIGGRAPH 2001 Computer Animation Festival. The video was made by NASA Goddard Scientific Visualzation Laboratory, together with Canadian Space Agency, RADARSAT International Inc.

more on the melting of glaciers

As already stated, glaciers in general are presently in retreat. It is important to realise that the Greenland and Antarctic ice sheets also produce glaciers, some of them very large.

A glacier is not static, it is a moving river of ice. The speed of that river varies according to several conditions. The illustration above gives a summary of the more important of these conditions. Detailed glaciology is a fairly new science, which is receiving considerable attention due to its great importance. This attention includes a lot of effort trying to understand exactly how the flow of ice works. It is not as easy as it sounds, because exploring deep within ice packs varies from dangerous to impossible.

Thus it is that various instrumentation is under continuous development, from dropping camera probes deep into ice fissures, driving for deep core samples and pinging the ice sheets from satellites, together with much else.

‘Before and after’images of melting glaciers.

past ice ages and interglacials

You will find graphs and commentary on recent temperature patterns at medieval warming. I now intend to look at the longer term paleoclimate temperature estimates.

Ice age temperature comparisons. Image credit: globalwarmingart.com

It is useful to remind yourself that temperatures were probably higher for longer in the last interglacial (the Eemian), and that the ice sheets retired further than they have at present. This had the consequence that the seas were higher. But it does look as if we are well on the way to rather accidentally breaking those records.

Notice that in the recent pattern of ice ages, the temperature rises rather rapidly and then starts to steadily peter out. A similar pattern is suggested for the present interglacial as shown in the first of the two graphs linked at medieval warming. In the second graph at medieval warming, can be seen strong hints that this decline pattern has been reversed in the last two hundred years. Of course, the lines do tend to wiggle around according to our estimates, but the trends are certainly suggestive, at least to me. You will also notice, from the table below, that the interglacials have not tended to last for a great percentage of the time during the ‘modern’ period.

Steve McIntyre has done something interesting with the first graph in the “ice age temperature changes” diagram, just above. What he has done is to put an arbitrary line across the graph that roughly estimates the planetary temperature at which Toronto becomes free of ice (he lives in Toronto!). And from this arbitrary line, he estimates the approximate lengths of the interglacials.

Steve McIntre's ice age graph.

Start (kyr) End (kyr) Length(kyr)
Holocene 12.3   12.3+
Eemian 130 114 16
240 kyr 244 240 4
330 kyr 337 325 12
Stage 11 418 395 23
[kyr = 1,000 years]

What is important to concentrate on is the completely arbitrary nature of the blue line. Had the line instead been linked to Glasgow or even Ottawa, the interglacials would become shorter; or had the line been moved southwards, the interglacials would, of course, become longer.

The definition of an interglacial is a rather arbitrary moving feast, nor does the glaciation extend tidily to a given latitude. It varies according to land and sea conditions, prevailing winds, and even interactions between the heights of the ice sheets. To add to this, the ice sheets advance and retreat according to their mood.

As you can see from the next diagram:

5 million year temperature comparison. Image credit: globalwarmingart.com

Back beyond the last six hundred thousand years [600kyr], you will see that Toronto would not have had serious glaciation for the previous 2.7 million years; and going even further back, there would also have been no glaciation for Toronto at all.

65 million year temperature comparison. Image credit: globalwarmingart.com
See The geological timeline for further information on Pal (Palocene), Eo (Eocene) etc.
Recall that on these timescales, planetary climate is also affected by tectonic plate movement.

Thus you will see that this period of glaciation is almost in the nature of a little local difficulty during the history of man, or even of dinosaurs, and I remind you again that here we are talking about Toronto.

Of course, we now have six billion people and growing fast, which we hope to feed. There is also a long-term trend of people moving to the coasts to live and to build vast cities. So interesting as this history is, it won’t be a great comfort if the seas rise by substantial numbers of metres, weather patterns undermine food production and major rivers dry up as glaciers disappear. For example, the Ganges is estimated to be 70% glacial flow during the summer.

“Over 2 million people in the La Paz region depend heavily on the thawing of Chacaltaya and neighboring glaciers for tap water and, indirectly, for electricity supplies.

“ "At least 35 percent of the drinking water comes from melting glaciers, and about 40 percent of the electricity," said Oscar Paz, the head of the Bolivian Climate Change Panel, a government task force.”

“Ecuador's capital Quito, with 1.5 million people, and the Peruvian capital Lima, with 8 million people, also rely on melting glaciers for water and energy supplies.” [Quoted from planetark.org]

related material
temperature and statistics

5°C increases in sea temperatures required to melt west antarctic

The collapse of the West Antarctic would eventually raise world sea levels by around 5 metres, but we’re not all doo-o-o-o-o-o-o-o-m-e-d-d-d yet.

“The U.N. Climate Panel has projected a best estimate that world atmospheric temperature will rise by between 1.8 and 4.0 Celsius by 2100...”

“ "The required ocean warmings, of the order of 5 Celsius, may well take several centuries to develop," wrote Philippe Huybrechts of Vrije University in Brussels in a commentary.” [Quoted from planetark.org]

Marker at abelard.org

“The seabed drill samples also showed changes in the tilt of Earth's axis, placing polar regions toward and away from the Sun, had played a major role in ocean warming and cycles of growth and retreat of the West Antarctic ice sheet, between three to five million years ago, said the scientists.

“Around four million years ago, rising carbon dioxide levels in the atmosphere, to around 400 parts per million, enhanced the warming
effect of the tilt cycles, they said.” [Quoted from planetark.org]

Marker at abelard.org

“Add Greenland, whose ice cap is even more vulnerable to climate warming, and global sea levels could rise up to 12 metres: What this would mean for human civilization is everybody’s guess.

“Now, apocalypse is fortunately not yet round the corner. Neither our children nor our grandchildren will probably have to abandon London, Tokyo or New York, or will need to rebuild them further inland. As things stand, global seal level rise exceeding one metre by the end of the century - which would be a lot, though - is unlikely.” [Quoted from nature.com]

agw - how much land will be lost to the global melt?

It gets very complicated.

"...Floods in Australia in late 2010 strangely resulted in water piling up on that continent, robbing the oceans of enough water to lower global sea level by 7 millimeters for more than a year..."

"Some facts are well established. Researchers can say that global ocean levels have risen about 19 centimeters in the last century. And the rate of rise has sped up. The 20th-century average is about 1.7 millimeters per year; since 1993 the average rate has nearly doubled — to about 3.2 millimeters per year."

"And any given city may have to contend with worse. While 70 percent of the world will see local waters rise within 20 percent of the norm, others will see extremes. In China, the Yellow River delta is currently sinking so fast that local sea levels are rising by up to 25 centimeters per year, nearly 100 times the global average. Places that were once covered by kilometers of ice, like northern Canada, are now rebounding upwards — which means local sea levels are actually falling in some parts of Alaska. But that upward-moving land is hinging nearby areas, like the U.S. East Coast, downward by millimeters per year — adding millimeters per year to the local sea level rise there."

If the melting goes as supposed without changing the variable, it will go on for thousands of years. The seas will rise by 60 or 70 meters. But then we can live in Greenland and Antarctica!

However, we can always rely on the professional denialist amateurs to stop it all by magic, hope, lots of capital letters, and inscrutable incantations.

new resource of antarctica imaging

“In support of the International Polar Year (IPY 2007-2008), LIMA brings the coldest continent on Earth alive in greater detail than ever before through this virtually cloudless, seamless, and high resolution satellite view of Antarctica.

“The U.S. Geological Survey (USGS), the British Antarctic Survey (BAS), and the National Aeronautics and Space Administration (NASA), with funding from the National Science Foundation (NSF), created LIMA from more than 1,000 Landsat ETM+ scenes.”

Marker at abelard.org

“Americans have occupied the geographic South Pole continuously since November 1956.” [Quoted from nsf.gov]

There is a webcam directed towards the Amundsen-Scott South Pole Station (pictured below), with current actual temperature and wind chill.

Amundsen-Scott South Pole Station. Credit: NSF/USAP

A virtual tour of McMurdo Station. The tour includes photos of Scott’s hut and much else.

The pantry of food left behind by Robert Falcon Scott and his companions in 1904.

Many links, including “scientific papers, articles, reports, datasets, maps, posters, and information on upcoming events in support of the International Polar Year (IPY)” at lima.usgs.gov.

related material
pressure on water resources
giant ice shelf broke free in the Arctic
biggest Antarctic peninsula ice shelf yet - Wilkins - goes unstable
another step to understanding antarctica and its temperature

advertisement

glossary

ice shelf:
floats on the sea/ocean;
ice sheet:
situated on land.

Thus, an ice shelf is effected by water temperature. The water is quite often frozen right down to the ocean floor. Thus the ice may not be acting as a shelf, but still be in contact with the water at the ice face. Shelved ice is under greater stress and, therefore, can be subject to major break-up.
 

bibliography

Glaciers by Hambrey and Alean

Glaciers by Michael Hambrey and Jürg Alean,
Cambridge University Press, 2004, hbk
ISBN-10: 0521828082 / ISBN-13: 978-0521828086

$49.00 [amazon.com] {advert}

£36.10 [amazon.co.uk] {advert}

Four and a half GoldenYak (tm) award
This book is beautifully illustrated and reasonably well researched. The technical stuff becomes marginally insecure at the edges, and I would have preferred some labelling right on some of the photo illustrations. In other words, this book has the feel of a really serious amateur and enthusiast. This is a good book for those wishing to know what glaciers and their effects look like, and to obtain a reasonable feel for this relevant area of climate science.

The book would have been awarded Five GoldenYaks had the precision been greater, and only Four if the photographs had not been so wonderful. Brilliant coffee-table prize for a young adult learning about the world and interested in this area.


Frozen Earrth by Doug Macdougall Frozen Earth: The Once and Future Story of Ice Ages
by Douglas Macdougall,
University of California Press, 2006
pbk: ISBN-10: 0520248244 / ISBN-13: 978-0520248243
hbk: ISBN-10: 520239229 / ISBN-13: 978-0520239227

$11.96 pbk [amazon.com] {advert} / $40.00 hbk [amazon.com] {advert}

£9.98 pbk [amazon.co.uk] {advert} / £15.95 hbk [amazon.co.uk] {advert}

Three GoldenYak (tm) award
A useful general reader, with history of the science. There is better science and science history around, but not much on this subject. While the book gives a good outline, there is a strong inclination to skip over difficult bits and do a bit of arm-waving. Useful for quick novelish reading.


Paleoclimatology by Raymond Bradley

Paleoclimatology by Raymond Bradley
Academic Press Inc., 1999, hbk
ISBN-10: 012124010X / ISBN-13: 978-0121240103

$66.32 [amazon.com] {advert}

£49.99 [amazon.co.uk] {advert}

Four GoldenYak (tm) award
This is a book you want if you wish to dig in really seriously. A good first semester reading and on-going reference book for those studying the area. Like so many science books, it could be far better laid out and organised. The illustrations and tables are copious, and useful. However, the paragraphs are often over-long and crammed with too much detail. This book is recommended for someone prepared for serious work.

With over five hundred pages of text and another hundred of bibliography and index, I feel I have my money’s worth, but then I’m a facts freak.

[shorter review] click to return to the index


return to abelard.org main site news and comment at abelard.org documents on alternative energies documents on alternative energies Japan zone sum will set you free art gallery the web pilot - mastering the Internet short briefings documents on energy and society Link to abelard.org's RSS newsfeed

email abelard email email_abelard [at] abelard.org

© abelard, 2007,17 may

all rights reserved

the address for this document is https://www.abelard.org/briefings/antarctica_melting_ice.php

2500 words
prints as 7 A4 pages (on my printer and set-up)

latest abstracts briefings information   headlines resources interesting about abelard