Things do change as society learns and education slowly improves.
However, if a person is pitchforked in among others who are less 'intelligent' beyond a certain degree, that person
tends to be socially isolated.
In such circumstances, they have less likelihood of learning to understand and to 'fit in' to the common culture.
At this point, they will be seen as 'odd'.
It does not matter that the culture is primitive and hag-ridden,
that the culture is often 'mad',
it is the person who is 'odd' who will be adjudged and treated as mad, threatening etc. by virtue of their differences.
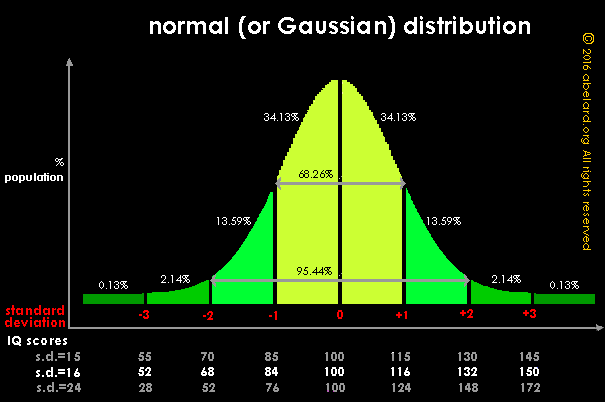
I shall use the system where the average (mean) IQ is standardised to 100 and the standard deviation is 16.
"Standardised to 100" means that a person with a 100 I.Q. is deemed to be of average IQ. When you see 'normal distribution', 'Gaussian distribution', or 'bell curve' or even "error curve", they all mean the same thing.
Graph showing normal distribution, with IQ scores in a population
Here, "standard deviation" [σ or sigma, s.d. or sd] is a (chosen/arbitrary) difference between IQ scores. The SD shows how different IQ scores are spread (distributed) relative to the standardised score of 100 IQ.
(See also On calculating magic quotients.)
Referring also to the graph at Is Intelligence Distributed Normally? By Cyril Burt, 1963, you will notice also that IQ scores in tests do not conform to the normal curve above and below 2 standard deviations (σ or sd). Trauma etc. can cause brain damage, making an anomalous blip in the lower regions of the normal curve of IQ.
You will also find further discussion of this at statistics and intelligence.
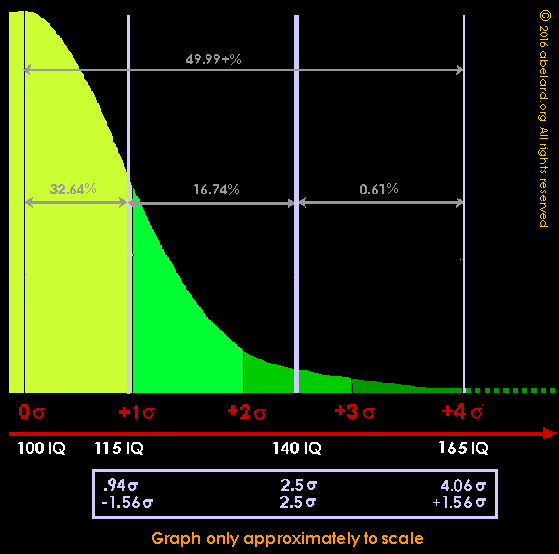
As you can see from the diagram below, the higher the IQ, the fewer the number of people in a general population having that IQ level or above.
Here, I am only talking about upper part of the distribution, that is IQs above the average (100 IQ), so only the upper half of the normal distribution graph is shown below.
IQ distribution around 140 IQ, 16 sd
By the time the 140 IQ level is reached, the normal curve [black line on Burt page graph] predicts 1:165 (one in a hundred and sixty-five), whereas in reality [red and green lines on Burt page graph], the number of people is about 1:70 (one in seventy).
By the level of 165 IQ, the normal curve predicts 1:40,000, whereas in reality that number is nearer to 1:3000 (one in three thousand). These figures can be read from the graph at Is Intelligence Distributed Normally? By Cyril Burt, 1963. Notice that the further away from average intelligence (0 sd, 100 IQ), the greater the reality figure differs from that predicted by the normal curve.
With a population of about 70 million in Britain, this suggests that, under present conditions (see also statistics and intelligence) there are about 23,300 Britons at the 165 IQ level. The normal curve predicts only about one-seventy-sixth of this number of this number (1,750 people). Nationwide, this means the reality figure is about 300 people for every
year level. The chance of meeting a person with an IQ of 165 in class 6 is very low.
Note also from the above graph, that the area under the graph between .94 and 2.5 sigma (115-140 IQ) is far larger than the area under the graph between 2.5 and 4.06 sigma (140-165 IQ); that is 16.74% compared to 0.61%, or more than 27 times as many!
This gives some notion of how difficult it is for a person at the level of 165 IQ to find peers with whom they can relate normally and naturally (see paragraph a). Also, the greater majority of those to whom they can relate on any easy level are considerably more likely to be beneath that level of ability than over it (see paragraph c).
Thus, with a class size of about 30, if there is a person at the 140 IQ level in the class. This means that
they will have a peer (at a similar level of IQ) in about 1 in 5 classes [(140 ÷ 30) people] in the school.
(Remember above this level, such a student is one person in 70 (1:70), so you need 2:140 people to have an average of two students at that IQ level).
Moreover, it is very likely that the second such student would not be in the same class as the first, making common friendships difficult. Thus, a 'brighter' child is likely to be isolated. (See also franchise by examination, education and intelligence.)
Acceleration is one solution to this problem that seems to work fairly well. (For more, as a example see Exceptionally gifted children, 26-page pdf.) However, the blob tend to run schools for their own benefit rather than for the customers.
Remember that some of the most able are already reaching the same intellectual level as teachers as early as 12 years old. It is quite ridiculous to insist on treating them as silly children. Of course, it is also not helpful to patronise and speak down to 5 year-olds or 3 year-olds, nor to treat them like interesting toys or status symbols. The sane objective is to encourage the young to learn to live in the real society, not to treat them as strange creatures living in an alienated goldfish bowl.
Isolation and institutionalisation of an age cohort is no way to build an effective society.
See also paragraph 33.
Of course, in the leafy suburbs, where the wealthier people live, the ratios will be better.
In the sink estates, they will be worse as the population increasingly assorts itself under present 'education' practices.
Thus in poorer areas, without incoming strivers from foreign lands (who will also tend to favour their own groups), the brighter child or family will be more likely to become isolated, as such communities become stripped of the upwardly mobile, more able people.
If a child is isolated, and further is bored by the work being trivial to them, they are likely to stop taking an interest, become behind in work, stop listening, and even to become a thorough nuisance in the classroom, start skipping school, and become involved in criminal activities - not all criminals are intellectually dim.
The average low-grade teacher will respond to this behaviour by regarding the child as a thorough pest and disruptive source, especially when the child is mentally quicker than the teacher, and creative in their 'cheek' and other attention-seeking behaviours.
The teacher will be very happy to see the child
dodging class as a solution to the problem.
Of course, less able teachers will also tend to end up where the conditions are less desirable.
When you have a child in the 165 IQ range, it is likely that, not only will the child be even more isolated, but by the age of 10 or so, they may also tend to be 'brighter' or more knowledgeable than their teachers.
With our present social structures, teachers usually are not inclined to become close friends with pupils (the lower orders in a school!).
IQs at university
I'll assume for the moment that it is those of highest IQ who go to university and the like. This is not so in fact. In reality, it is those from the more educated homes, those with relevant networks, those who are encouraged to study and grind hard!
Only 50 or 60 years ago, about 10% of the population was educated to university level, and now it is approaching 50%!
Given the assumption that 10% go to uni, their average IQ will be around 126 IQ, but only about 1 in 10 of these will be above 140 IQ.
When 50% go, the average IQ will be about 110 IQ, but a lower proportion of this larger university population will be above 140 IQ. (Remember, some universities are more selective than others.)
Looking at the graph, note that at any selected point (IQ level) there are more individuals below that point than above it. Thus, there are more individuals closer to the average line at zero (100 IQ), than there are further from the average.
Nowadays, the average university student has an IQ of about 110, whereas 50 years ago it would have been nearer 125+ IQ (see the graph above).
Despite myths to the contrary, IQ levels are not fixed, neither in one person nor in a population.
IQs are increasing in the general population - this is called the Flynn Effect. Individual IQ can be improved/increased/raised by study.
Taking into account the Flynn effect, any claim that the overall standards in universities are falling is dubious to say the least. The results can be seen all around in the vast advances of civilisation over the past century or so.
This IQ advance is in the region of one standard deviation in 40 years, that is approximately every two generations. This is plenty to justify and explain the great expansion of university degrees and placements without any nonsense about 'falling standards'.
As you will see from Franchise by examination, education and intelligence, that does not mean a necessary 'dumbing down' as aging middle class fogies like to believe. It means a great widening of opportunity and a slowly improving, general standard of education.
Within a wide range, people can be taught to think and study just as they can be taught to read and write. To a considerable extent, intelligence or 'IQ' can be taught.
IQ and friendship
If I try to start a discussion with a moo-cow, a dicky bird, or a pussy cat, the conversation tends to be somewhat limited; although this can vary. All three are likely to be friendly when there is free food on offer. They do, of course, vary in personality. The moo-cow tends to be phlegmatic and ignore me when I approach, while the dicky bird, being of a paranoid nature, takes flight if it doesn't know me well. The pussy cat may even approach me and start creeping around me in an obsequious manner.
Various writers suggest likewise that interaction between humans does not flow fluently if the IQ gap is greater than 20 to 30+ points (s.d. = 16). Again, personalities vary. Commonly, the more developed may say, "Here is a useful human being, let's see what work I can put him to", whereas less able will often react with "I can't understand what this idiot is on about, obviously he is trying to trick me and exploit me". Meanwhile, the Socialist politician will pander to this paranoia and idiocy in order to actually exploit what she sees as another sucker.
IQ and entrepreneurs
There is a well-known management and political practice, sometimes called the Peter Principle, where the manager or politician always contrives to appoint people stupider than himself, thus avoiding competition with his own position. A similar problem can be seen in many family businesses. The child does not quite have the abilities of the founding entrepreneur. By the third or fourth generation, the spoilt and profligate descendant gambles away or otherwise undermines the profitability of the enterprise (this process is known to statisticians as reversion to the mean). As you will notice, the decline of companies is a rational process, not some great surprise.
IQ, friends and acquaintances
An average human can make approximately 12 friends and 200 acquaintances - so much for Facebook friending.
A person of 160 IQ, in a class of 30 classmates, is going to be pressed for age-equivalent friends even within a 25 IQ difference (16 s.d.). There may be 1 or 2% above that level in the general population.
By the time you reach 165 IQ, you will be very lucky even to meet another one at that level in your home town. As you rise up the IQ scale, most available relationships will be very unlikely to be 'equal' intellectually.
A 165 IQ child working in an average classroom will find great difficulty making compatible friends, such children are likely to become arrogant and bored, not responses which a sane educator would wish to encourage.
I will assume that the position at university is a bit better, but not much (see IQs at university). There are speciality clubs and the internet offers new options.
From these numbers it is possible to derive some social objectives. For instance, for how many potential friends or acquaintances does a social unit (town, school, company, university) wish to aim?
This will advise the structure, size, selectivity policies.
Remember,
this is not about 'education' levels in rather clunky school systems, where the dull but fortunate child can pass the parrot test, while an intelligent child from a house without books and mildly able parents cannot.
the moving level of IQ in the general population
Old-style schools, where maybe 20% went to a selective school, causes as many problems as it solves. In fact, even during the 1960s and later, less than 10% went onto higher education, including polytechnics. In 1945, it would have been less then 5%. Selective schools may once have been a pragmatic answer to a devastated country after a great war, but that will not meet much changed modern conditions.
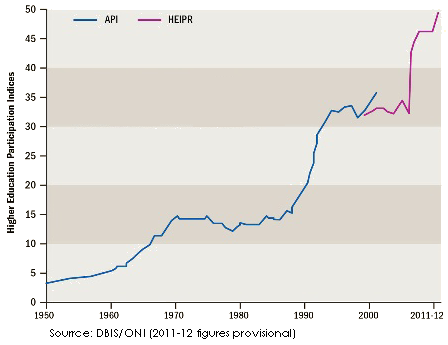
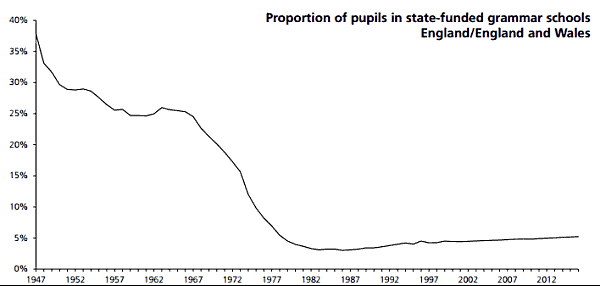
You will see two graphs (end note 6 below). Take as an example 1960 where it is estimated that maybe 25% went to a grammar school. Yet of these, only about 5% ended up in higher education. It was not just the three quarters who were headed for lesser jobs, but also four-fifths of those who went into grammar schools.
While I cannot rely on these numbers with much confidence, the modern propaganda that is coming from the few who did do well in grammar schools, is that these schools helped the poor escape their background.
Most of those that did do well were, in fact, those that came from better educated and upper middle-class backgrounds. Their parents could afford to help support their children through extended education, instead of them being forced to leave school to help support their families. As you can see on closer examination, the idea of the grammar school as an escape route form poverty becomes very thin.
Interestingly, if you examine the graphs you can see that, in general, as grammar school attendance fell, in fact, higher education participation rose!
Notice that
25% went to grammar schools in 1960. About a fifth of them went into
higher education. Now approximately 50% (half) go into higher education. Perhaps then, about 250% 'should' go to grammar schools
in order for 50% to go onto higher education?
Meanwhile, I will assume that those going to uni in 1960 averaged
120 IQ. I am, as usual, using a 16-point standard deviation.
1960 is more than 55 years ago, thus well above 2 generations
and a shift of at least 1 standard deviation. Then, an average uni student of 1960 would register as 126 IQ
against the present day 110 IQ level. Thus, 110 on a present day test would be equivalent to 126
on an IQ test of nearly 60 years ago.
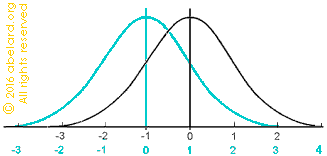
Estimated bell curve shift in two generations
selective schools - grammar schools
Thus, there is no useful evidence that grammar schools would
have any real-world advantage, and the hoped for effects are
already being achieved without grammar schools
and without the foolish social problems that come with trying
to divide society by IQ testing.
Neither is unalloid streaming a useful answer to the problems of differential ability. Putting children into artificial environments does not help them to adjust to the real world. The closer schools can be integrated with wider society, the better. This is where children learn about differences and ability, and gain experience of relating to those of different abilities.
The more parents and other adults are involved in a school, and the more the young participate in the real world, the better. Children will not develop into thoughtful and experienced adults by isolating them in a make-believe world of fairy tales, children's parties, and over-protection.
The structure of institutionalised schools is counter-productive to effective education. Rather than segregate the most able children in specialist schools, enrichment is a better option, with the likes of summer schools and regular workshops. To integrate able people in society, it is necessary to have them helping slower pupils, not isolate them by streaming or specialist schools. It is better that such young people learn responsibility; and that slower students realise that the more able help them, rather than the more able being percieved as posing a threat.
To achieve all this effectively will require more able and more professional lead teachers. See also paragraph 10.
and without intellectual stimulation?
Orphaned children in Communist Romania were kept in pens and cages within the orphanages, with little interaction with others. John Bowlby found that these children were unable to relate, to interact, to make friends because they had not had the right immersion in this sort of activity at the appropriate age. This is similar to the findings in kittens who stay asocial if not disciplined by other cats at the right age. There is much other similar evidence - inability to recognise straight walls, inability to walk.
A similar situation can happen with only children. This newspaper article
provides an interesting, recent example of the problems with being an only child.
returning to the madness of logicians
I will assume that to reach the level required by the major examples of logicians (see some important logicians), an IQ level of at least 165 is required, along with the drive and dedication necessary to produce work of that level. [See notes to second graph above].
This is illustrated, for instance, in the 2014 film The Imitation Game, that follows Alan Turing's life from his school days until his death at 41 years old.
standard deviation
A measure of the spread of probabilities of a random variable.
calculating
magic quotients
There are two major ways to calculate human abilities.
Both methods are often referred to , at times, as I.Q.,
reading quotient, etc. When dealing with children, it
is often thought useful to compare them with their age
peers in the culture. To this end, a reading age assessment
is made by comparing the child’s present performance
to the assessed average age of a child who meets that
performance standard, and then perhaps generate a quotient
to make it look ‘scientific’. This can be
done by the following calculation.
Reading Test
calculation
Reading age x 100 = Actual
age
The second major method is to calculate the spread of
abilities at a particular age and then assume those abilities
fall ‘randomly’. Then, by varieties of jiggery-pokery,
make sure they do fit such a distribution. If you care
enough to start swimming in these murky waters, you may
enjoy yourself by reference to Intelligence:
misuse and abuse of statistics and to Is
Intelligence Distributed Normally? By Cyril Burt, 1963.
Experience has shown that using the age quotient, a standard
deviation of somewhere around fifteen points appears,
if you care to make the assumptions inherent in the second
method - no don’t worry about it, unless you really
are up for the murky swim. You can teach a child to read
perfectly well, without knowing anything much at all about
these magical potions.
The area under the graph illustrates (depicts) the estimated (predicted) numbers of individuals occuring in that region.
In this example, the area under the graph shows the numbers of people at that IQ range.
Peter also goes on a lot about the inclination to 'promote' managers just to move them out of the way, another venality is to give a glowing reference to an idiot in that they will go and work for a competitor, while making the job candidate unlikely to sue you - it's a wicked world.
regression to the mean
It is vital not to make the common mistake of believing that regression to the mean is some sort of genetic rule. It is, in fact, a statistical artefact. When ever you hear the word 'statistical', you know you are dealing with generalities, not specifics; groups and not individuals.
If the average IQ of a population is set at 100, a sample taken from that population may be above or below the population mean (average). Turning to entrepreneurs, the average entrepreneur who starts a new and successful business will have an IQ above that of the general population. His children, and his wife and mistress, despite assortative mating, are likely to be closer to the population average. Thus at large, later generations running the companies are likely to be less able than the originating founder.
Repeating, these are average effects, and thus there is some chance that the son taking over the business maybe more able, and has a good chance of being better educated than the founder.
Higher education participation rates 1950-2010 (source: government statistics; also from Dept BIS)
compulsory schooling in the UK
1880 ... 5 years to 10 years old
1893 ................to 11 years
1899 ................to 12 years
1921 ................to 14 years
1944 ................to 15 years
1972 ................to 16 years
Alongside this tendency, increasing provision and pressure was
developing for part-time schooling,
for instance evening school, day release, apprenticeships. Considerable efficient training also occurred in the armed forces.
I do not want to suggest that
things are not improving; they are, even if far too slowly. Analysis of
IQ data over many decades shows that IQ is rising by about 1 standard
deviation every 40 years.
This change is about equivalent to a person who, 80 years ago, would have
been regarded as average or ‘normal’ intelligence, but in
today’s world would be rated as borderline mentally defective! It
is abundantly clear that this change is due to improved educational standards,
despite the constant bleating of the old Jonahs ‘that it was far
better in the olden days’. This change has been identified and tracked
by J. Flynn and is now known as The Flynn Effect.
Flynn argues that if the effect were real; we would
now be seeing a veritable renaissance and claims that no such renaissance
is apparent. I strongly dissent from this view—we have not come
from horse and buggy to Concorde and computers in many homes and most
western schools in a century without a very clear renaissance; but very
much more does remain to be done.
For convenience in this document, I am using a generation to be twenty years. That is the average time in a society between a child being born and the child of that child being born. This time can vary considerably between societies. For instance, in potato-famine Ireland where marriage was often long delayed, a generation has been at estimated at over thirty years, whereas in many peasant societies marriage has been common at twelve years old. Notice that these variations can make a great difference to rates of population growth.