


|
|
|
|
|
|
||
|
|
|
|
|
 |
how atmospheric
|
|
|
|
||
| on energy | on global warming | |||
| sustainable futures briefing documents |
Tectonics: tectonic plates - floating on the surface of a cauldron |
|||
|
||
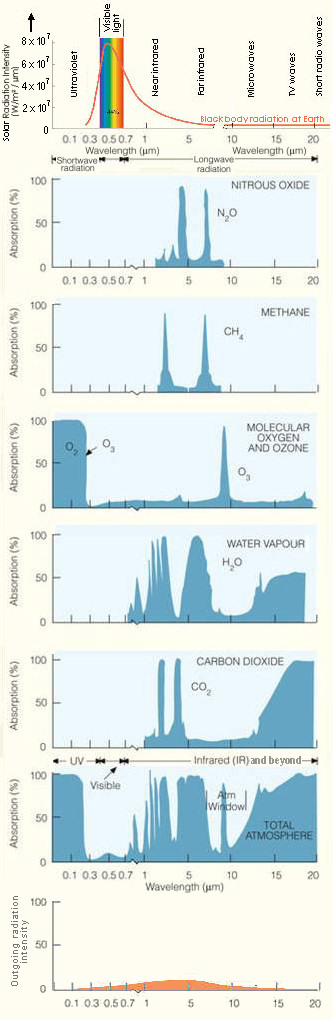
the greenhouse effect
The bigger the ice fields, that is the higher the albedo, the lower the Earth’s energy balance. For more detail, see radiative forcing components diagram. But, setting aside any changes in conditions, incoming energy from the Sun minus energy reflected out into space from the Earth is zero. This what is meant by an energy balance. The various ways in which the incoming energy from the Sun interact with the Earth and its atmosphere can be crudely seen in the series of diagrams to the left. The energetic ‘particles’ from the Sun are, by stages, converted to lower energy forms (by particle collisions). Thus, the outgoing energy spectrum will be shifted rightwards (towards the infra-red and beyond) of the incoming energy spectrum, while what remains is perceived by us on Earth primarily as light and warmth. A fundamental error is being spread that, because a global warming gas (forcing) is transparent to a large amount of the incoming radiation from the sun, it cannot be having much effect in terms of warming the planet. This is an error that ignores a real-world fact that incoming radiation is converted to longer wave-lengths as it impacts the atmosphere and the planetary surface. It is these longer wave-lengths that are then blanketed from escaping back into space. If it were not for this wave-length conversion (mechanism), the greenhouse gases (GHGs) would not be causing the rise in the level of the Earths energy balance (examine the graphs to the left to get some idea of how this works). The energy balance for the Earth is about 33° Centigrade higher than it would otherwise be if there was no greenhouse effect. The average temperature on Earth is about 16° Centigrade. Thus, it would be more like -17° Centigrade, if there were no greenhouse gases in the atmosphere and, therefore, no greenhouse effect. This page will give you a rough idea of physical and chemical data related to greenhouse effects. See also planetary heat circulation. This section is developing in response to the desperate attempts of the fossil fuel industry, various amateurs and conspiracy theorists who wish to rubbish the growing consensus on the anthropogenic global warming effect. Much of this page is in response to the almost surreal claims that carbon dioxide is, somehow, not a major part of the problem. It is my, perhaps vain, hope that by the end of this page, any such nonsense will be taken less seriously. Things are moving very quickly, as vast amounts of data is being collected year by year. In the next section, pay close attention to the
dates of the three items quoted. so where are we right now (march 2007)
isotopes and global warmingAll this global warming stuff gets complicated. You may hear all the amazing claims and be inclined to ask, “How do they know that?” A lot of the advances and discoveries are made by a careful analysis of isotopes. Isotopes are versions of chemical elements which have slightly different atomic weights, from having different numbers of neutrons. The isotopes that vary from the basic element are, in general, more rare than the basic isotope. Most of the carbon in the world has six neutrons, and six protons, which gives carbon an atomic weight of 12. But there are also carbon atoms out there with seven or with eight neutrons, which are known as carbon 13 (13C) and carbon 14 ( 14C) . Now, the ratio for the different quantities of these various carbon isotopes in the air are known and can be measured with great accuracy. The ratios vary according to circumstances. Plants prefer to use 12C, rather than 13C, for photosynthesis. They take in both 12C and 13C version of carbon dioxide (CO2) from the inhaled air. During respiration, plants exhale the unused carbon dioxide. Because the plant has used 12C carbon dioxide preferentially to 13C carbon dioxide for photosynthesis, the percentage of carbon dioxide that is 13C carbon dioxide is higher in the exhaled air than in the inhaled air. Thus, scientists talk of the exhaled air being 12C depleted. Also, with carbon, the rare isotope 14C is not found in the carbon-rich fossil fuel deposits of coal and oil. 14C is radioactive, with a half-life of 5,730 years. It has had millions of years during its sojourn underground to decay into the more common forms. Thus from ratios like this (the ratio of 12C carbon dioxide to 14C carbon dioxide) the amount of carbon in the air from anthropogenic sources can be estimated. And the scientists are not just guessing, believe it or not. The table below shows some isotopes, together with some of the uses to which they are put. As you will see, there are several naturally occuring isotopes of both carbon and oxygen. Thus, you will immediately guess that there are various possibilities for the composition of carbon dioxide (CO2). There are six relevant permutations for this discussion (3 carbon isotopes times 2 oxygen isotopes). The other isotopes of these elements are not relevant to this discussion. oxygen in ice and oxygen in water: dating methods
Oxygen take-up, that is oxygen trapped in ice or incorporated in shells, is used for detecting two different things - an assessment of the amount of water tied up in the ice sheets, and the current ambient temperature. This take-up is recorded in the shell formation of foraminifer microfossils in oceanic sediments. However, these two causes can be confused. My reading suggests that both will act in the same direction and the causes may be separated, but as yet I am unconvinced that this is so. The major method of finding the age of sea sediment cores is magnetism. The Earth’s magnetic field switches direction from time to time, and therefore the magnetic alignment of different times represented is in the core and indicates when that part of the core was laid down. Magnetism is also used for distant core samples to locate their original position on the globe, as the angle between position and the pole varies with latitude. Obviously, these two usages can be confused.
|
||
| element | isotopes | ||||||||||||||||||||||||||||||||
| carbon | 12C | 13C | 14C | ||||||||||||||||||||||||||||||
| uses of isotopes | coal, diamonds, graphite (98.9%) |
absorbs radio waves, used in nuclear magnetic resonance spectrometry to study organic compounds (1.1%) | radioactive, half-life: 5730
years, used radiocarbon dating objects [1] (trace) |
||||||||||||||||||||||||||||||
| oxygen | 16O, 17O, 18O | ||||||||||||||||||||||||||||||||
| uses of isotopes | stable
components of atmospheric oxygen: |
||||||||||||||||||||||||||||||||
| hydrogen | 1H - protium (standard hydrogen atom) |
2H - deuterium (‘heavy’ hydrogen) |
3H - tritium | ||||||||||||||||||||||||||||||
| 99.985% of naturally ocurring hydrogen | 0.0115% of naturally ocurring hydrogen | traces only half-life: 12.32 years |
|||||||||||||||||||||||||||||||
The changing ratio of 14C to 12C, as we burn fossil fuels, allows a calculation of how much anthropogenic (fossil) carbon is in the air. As 16O is preferentially evaporated relative to 18O, an assessment can be made from ice core and microfossil analysis as to the amount of water tied up in ice at any one time. There are several other isotopes of both oxygen and of carbon, but they are only usually available through laboratory fabrication. Hydrogen isotopes are used in ice core analysis, but I don’t know what for yet! |
|||||||||||||||||||||||||||||||||
mercury and venusThe average temperature of Venus is much higher than that of Mercury, even though Venus is nearly twice as far from the sun as Mercury!
An Astronomical Unit (AU) is defined as the average distance from the Sun to the Earth. It is approximately 150 million kilometres, or a bit over 8 light minutes. The Solar Constant is different for each point in space. It is the amount of energy from the Sun that reaches that particular place. It can be calculated very easily from this simple formula: S.C.x = S.C.earth/r2 Where S.C.x is the solar constant at point x, and r is the distance from the Sun to x (in AU). This formula is an example of an inverse square law - the closer you get to the Sun, the more of a difference going a little bit closer will make. Thus, while the difference in the distance from the Sun to Mercury and from the Sun to Venus is approximately the same as the difference in the distance from Sun to Venus and from the Sun to the Earth, the amount of energy drops to less than a third between Mercury and Venus, but only drops to about half between Venus and the Earth. The average temperatures without atmosphere and albedo assume that each planet is black. A black planet has an albedo of 0, which means that it absorbs everything and reflects nothing. However, planets are not black! The Earth, for example, has an average albedo of around 0.3. This means that 30% of the incoming energy from the sun is reflected straight back. Thus, a more realistic figure for the average temperature of the Earth without an atmosphere would be -17oC, rather than +5oC. Nobody knows the albedo of Venus, because the atmosphere is so thick that nobody can see the surface. In all likelihood, however, Venus’ surface is not black, so the average temperature of Venus without an atmosphere would be significantly lower than 55oC.
end notes
|
|||||||||||||||||||||||||||||||||
© abelard, 2007,26 march the address for this document is https://www.abelard.org/briefings/global_warming_atmospheric_chemistry_physics.php 2500 words |
| latest | abstracts | briefings | information | headlines | resources | interesting | about abelard |
 Some
people do not like this expression, but it suits me just fine. It is a
pretty damn good description. The light from the sun comes in, and the
greenhouse gases trap some of the heat radiated from the Earth. It’s
Some
people do not like this expression, but it suits me just fine. It is a
pretty damn good description. The light from the sun comes in, and the
greenhouse gases trap some of the heat radiated from the Earth. It’s